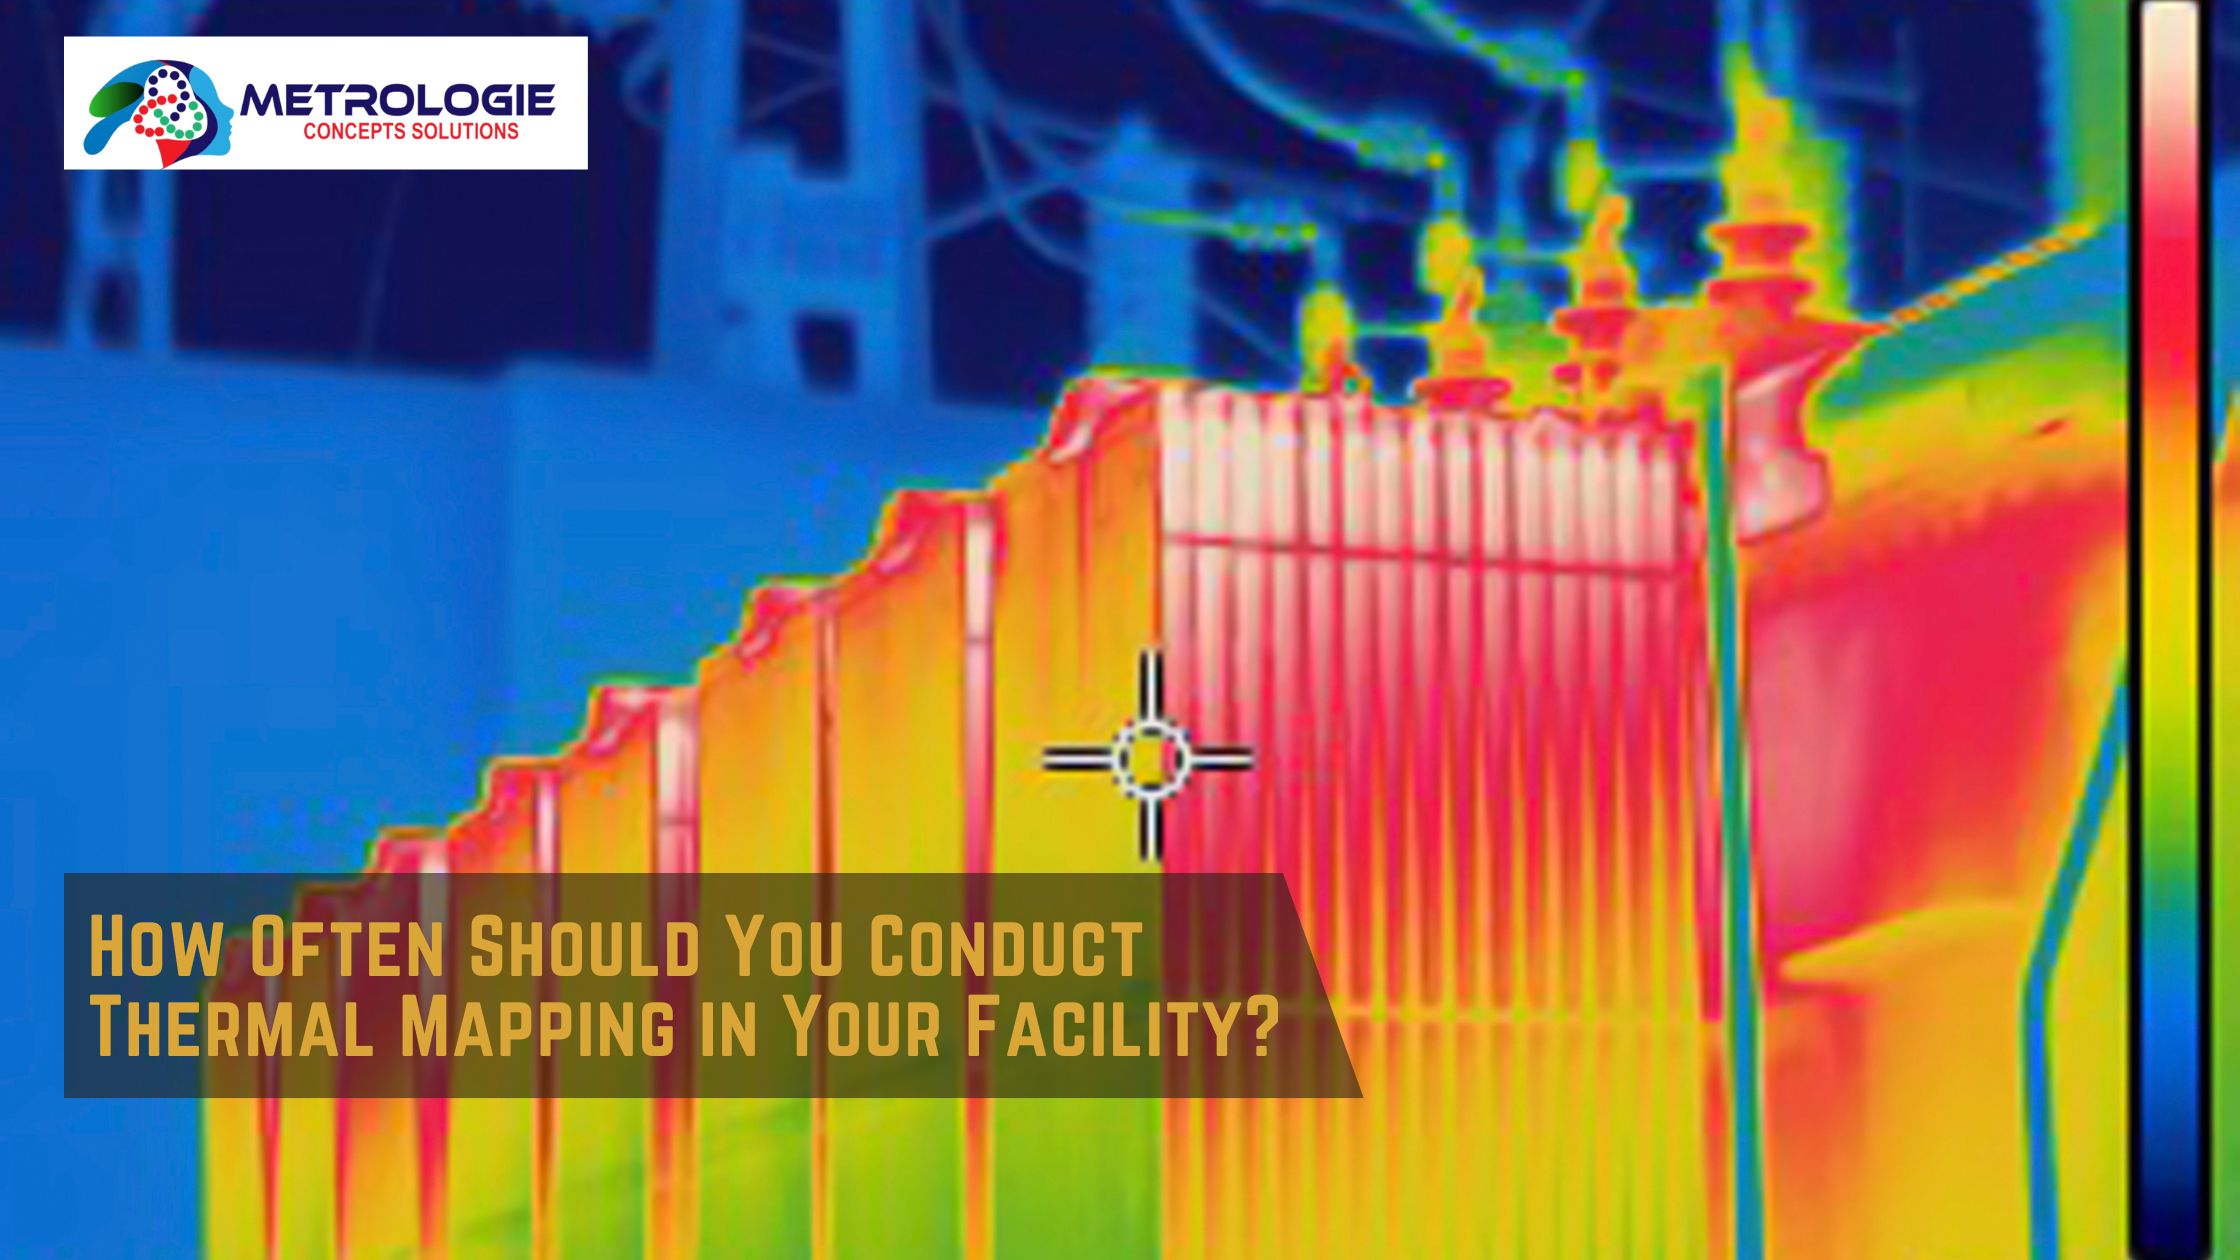
In the dynamic and often demanding environment of modern facilities – be they manufacturing plants, data centers, hospitals, commercial buildings, or research laboratories – the health and efficiency of critical systems are paramount. Unseen problems, particularly those related to heat, can lead to costly downtime, equipment failure, safety hazards, and significant financial losses. This is where thermal mapping, also known as thermography or infrared inspection, emerges as an indispensable diagnostic tool. By visually representing temperature distributions, thermal mapping allows facility managers and maintenance teams to “see” heat, revealing anomalies like overheating electrical components, inefficient insulation, mechanical friction, or moisture intrusion that are invisible to the naked eye.
The value of thermal mapping for predictive maintenance (PdM) and condition-based monitoring (CBM) is universally recognized. It enables the proactive identification of potential issues before they escalate into catastrophic failures, thereby minimizing unplanned outages, extending asset lifespan, and enhancing safety. However, a common and critical question that arises for any facility manager or maintenance professional considering or implementing thermal mapping is: “How often should we conduct these inspections?”
There isn’t a one-size-fits-all answer to this question. The optimal frequency for thermal mapping is not a static number but rather a dynamic variable influenced by a complex interplay of factors unique to each facility, its equipment, operational criticality, and regulatory environment. Too frequent, and you might incur unnecessary costs and resource allocation. Too infrequent, and you risk missing critical precursors to failure, negating the very purpose of proactive monitoring. Striking the right balance is key to maximizing the return on investment from your thermography program.
This comprehensive article will delve into the multifaceted considerations that dictate the ideal frequency of thermal mapping inspections in a facility. We will explore the various influencing factors, from the type and criticality of the equipment being monitored to its operational environment, historical performance data, and compliance requirements. By dissecting these elements, we aim to provide a robust framework and practical guidance that empowers facility managers and maintenance professionals to develop a strategic, cost-effective, and highly efficient thermal mapping schedule tailored to their specific operational needs and risk profiles, ultimately optimizing asset performance and ensuring continuous operational integrity.
I. The Core Purpose of Thermal Mapping in Facilities: Why Do It At All?
Before discussing frequency, let’s briefly reiterate the fundamental reasons facilities leverage thermal mapping.
A. Predictive Maintenance (PdM) and Condition Monitoring
- Early Problem Detection: Thermal imaging identifies “hot spots” (or “cold spots”) that indicate impending equipment failure due to increased resistance, friction, or insulation breakdown. This allows for scheduled repairs before breakdown.
- Non-Contact Inspection: Inspections can be performed safely on energized electrical equipment or operating machinery, reducing risks to personnel.
- Non-Destructive: No need to shut down or dismantle equipment for inspection.
- Reduced Downtime: Proactive repairs minimize unplanned outages, which can be astronomically expensive in production environments.
- Extended Asset Lifespan: Addressing issues early prolongs the operational life of valuable equipment.
B. Safety and Risk Mitigation
- Fire Prevention: Overheating electrical components are a leading cause of industrial fires. Thermography directly mitigates this risk.
- Personnel Safety: Prevents injuries from equipment failures or electrical hazards.
- Compliance: Helps meet safety standards and insurance requirements.
C. Energy Efficiency and Cost Savings
- Building Envelope Analysis: Identifying missing insulation, air leaks, and moisture intrusion, which lead to significant energy waste (heating/cooling).
- HVAC System Optimization: Detecting blockages, leaks, or inefficient operation in heating, ventilation, and air conditioning systems.
- Reduced Energy Bills: By fixing identified energy inefficiencies.
D. Quality Control
- Process Monitoring: Ensuring uniform temperatures in manufacturing processes (e.g., curing, drying, heating).
- Product Integrity: Identifying thermal anomalies in products that may indicate defects.
Given these critical benefits, the question then shifts from if to how often these valuable insights should be gathered.
II. Key Factors Influencing Thermal Mapping Frequency
Determining the optimal frequency is a nuanced decision that relies on a careful assessment of several interconnected variables.
A. Equipment Criticality
This is arguably the most important factor. Not all equipment in a facility holds the same importance to operations.
- Mission-Critical Assets (Tier 1):
- Description: Equipment whose failure would lead to immediate, significant production shutdown, massive financial loss, safety hazards, environmental damage, or regulatory non-compliance.
- Examples: Main power transformers, critical switchgear, primary production lines, main chillers in data centers, life-support systems in hospitals, key pumps in chemical plants.
- Recommended Frequency: Most frequent. Often monthly to quarterly. For extremely critical or rapidly degrading assets, even weekly or continuous online monitoring might be justified.
- Rationale: The cost of downtime or failure far outweighs the cost of frequent inspections. Early detection is paramount.
- Process-Critical Assets (Tier 2):
- Description: Equipment whose failure would cause significant disruption but might not immediately halt all operations. Redundancies might exist, but failure would still be costly.
- Examples: Secondary distribution panels, smaller motors, HVAC units for non-critical areas, non-primary servers.
- Recommended Frequency: Quarterly to semi-annually (every 3-6 months).
- Rationale: Regular monitoring is still highly beneficial to prevent major disruptions and manage maintenance proactively.
- Support Assets (Tier 3):
- Description: Equipment whose failure would cause minor inconvenience or whose repair/replacement is inexpensive and non-disruptive.
- Examples: Lighting circuits, non-critical office equipment, small auxiliary pumps.
- Recommended Frequency: Annually or bi-annually (every 12-24 months), or as part of general building surveys.
- Rationale: Less frequent inspections are cost-effective, as the risk and impact of failure are low.
B. Operational Environment and Conditions
The environment in which equipment operates significantly affects its thermal performance and degradation rate.
- Harsh Environments:
- Description: High temperatures, high humidity, dust, dirt, corrosive atmospheres, vibration, or exposure to chemicals.
- Examples: Steel mills, chemical processing plants, outdoor electrical substations, facilities near coastlines.
- Impact: Accelerates wear and tear, increases the likelihood of electrical resistance issues, bearing failures, or insulation degradation.
- Recommended Frequency: More frequent. Quarterly to semi-annually.
- Clean/Controlled Environments:
- Description: Climate-controlled offices, data centers (unless specific hot spots are known), pharmaceutical clean rooms.
- Impact: Equipment generally experiences less environmental stress.
- Recommended Frequency: Less frequent. Annually to bi-annually, focusing on known high-load areas.
- Vibration/Mechanical Stress:
- Description: Equipment subject to constant vibration, heavy loads, or frequent start/stop cycles.
- Examples: Conveyor systems, large fans, pumps, crushers.
- Impact: Increases the risk of loose connections, bearing wear, and motor winding degradation.
- Recommended Frequency: More frequent. Quarterly to semi-annually.
C. Equipment Age and Historical Performance
Newer equipment typically requires less frequent inspection than older assets, and historical data provides valuable insights.
- New Equipment/Warranty Period:
- Description: Newly installed equipment, especially during its initial operational period or under warranty.
- Impact: Less prone to immediate failure unless there’s an installation defect.
- Recommended Frequency: Initial baseline inspection upon commissioning. Then, follow manufacturer recommendations or industry standards. May start with slightly higher frequency (e.g., semi-annually for a year) to catch “infant mortality” issues, then reduce.
- Aging Equipment:
- Description: Equipment nearing or past its expected lifespan.
- Impact: Increased likelihood of wear-related failures, insulation breakdown, and overall degradation.
- Recommended Frequency: More frequent. Quarterly to semi-annually.
- Historical Thermal Data:
- Description: Past thermal inspection reports and maintenance records.
- Impact: Provides crucial trend analysis. If a component consistently shows increasing temperature differentials between inspections, it indicates a developing problem and might warrant more frequent checks. If it’s consistently stable, frequency might be reduced.
- Action: Leverage this data to adjust intervals dynamically.
D. Regulatory and Insurance Requirements
Compliance often dictates minimum inspection frequencies.
- Industry Regulations:
- Description: Certain industries (e.g., mining, oil & gas, nuclear, aviation, healthcare) have strict regulations that may mandate specific inspection frequencies for critical electrical or mechanical systems.
- Impact: Non-compliance can lead to fines, operational shutdowns, or loss of licenses.
- Action: Always adhere to the strictest applicable regulatory requirements.
- Insurance Policies:
- Description: Some insurance providers offer reduced premiums or require regular thermal inspections as a condition of coverage, particularly for fire prevention (electrical systems).
- Action: Check your insurance policy for specific thermography requirements.
E. Maintenance Budget and Resources
Practical constraints play a significant role in determining what’s feasible.
- Resource Availability:
- Description: The number of qualified thermographers (in-house or contracted), availability of thermal imaging equipment, and access to necessary personnel (e.g., electricians to open panels).
- Impact: Limited resources may necessitate prioritizing critical assets and potentially longer intervals for less critical ones.
- Budget Constraints:
- Description: The allocated budget for predictive maintenance, including equipment purchase/rental and personnel/contractor fees.
- Impact: Forces a balance between desired frequency and financial feasibility. A robust cost-benefit analysis can justify investment in higher frequencies for critical assets.
F. Manufacturing/Operational Schedule
- Production Cycles: For manufacturing plants, inspections often need to be scheduled during planned downtime or non-peak hours to minimize disruption. This might limit inspection windows.
- Seasonal Variations: For building envelope inspections, it’s often best to perform them when there’s a significant temperature differential between inside and outside (e.g., during peak heating or cooling seasons) to maximize thermal contrast for detecting insulation or air leakage issues.
III. Developing a Thermal Mapping Schedule: A Step-by-Step Approach
Creating an effective schedule involves a systematic process, moving from assessment to implementation and continuous improvement.
Step 1: Asset Inventory and Criticality Assessment
- Action: Create a comprehensive list of all equipment suitable for thermal inspection. For each asset, assign a criticality rating (e.g., Tier 1, 2, 3) based on its impact on production, safety, and business continuity if it fails.
- Tool: Use a spreadsheet, CMMS (Computerized Maintenance Management System), or EAM (Enterprise Asset Management) system.
Step 2: Risk Assessment for Each Asset
- Action: For each asset, assess the likelihood of failure and the potential consequences of failure. Consider factors like age, operating environment, historical issues, and load.
- Tool: Risk matrix (likelihood vs. consequence). High-risk assets will warrant more frequent inspections.
Step 3: Consult Manufacturer Recommendations and Industry Best Practices
- Action: Review OEM manuals for recommended inspection intervals. Research industry standards (e.g., NFPA 70B for electrical maintenance, NETA ATS/MTS for electrical testing, ANSI/NETA for specific equipment).
- Note: These are starting points; adjust based on your specific operational context.
Step 4: Define Baseline Frequencies (Initial Schedule)
- Action: Based on the criticality, risk assessment, and initial research, establish a preliminary thermal mapping frequency for each asset or group of assets.
- General Guidelines (as a starting point):
- Critical Electrical Equipment (e.g., main switchgear, transformers): Quarterly or Semi-annually.
- Critical Mechanical Equipment (e.g., large motors, pumps, bearings): Quarterly or Semi-annually.
- General Electrical Distribution (e.g., sub-panels, lighting contactors): Annually.
- General Mechanical (e.g., smaller motors, HVAC units): Annually.
- Building Envelope (insulation, air leaks): Annually (during peak heating/cooling seasons) or every 2-3 years as part of a major energy audit.
- Roofing: Annually, typically in late fall or early spring after a hot day or when moisture differentials are optimal.
- General Guidelines (as a starting point):
- Consider Seasonal Factors: Schedule building envelope or roofing surveys at optimal times of the year for thermal contrast.
Step 5: Budget and Resource Allocation
- Action: Evaluate if the proposed schedule aligns with your available budget and internal/external resources. If not, prioritize the most critical inspections.
- Consider ROI: Justify the investment by estimating potential savings from avoided downtime, energy efficiency improvements, and extended asset life.
Step 6: Implement the Schedule and Baseline Inspections
- Action: Begin conducting thermal mapping according to the established schedule.
- Baseline Data: The very first inspection is crucial for establishing baseline thermal performance for each asset. This is your “normal” reference point.
Step 7: Document Findings and Action Taken
- Action: For every inspection, generate a clear, concise report that includes:
- Visible light images and corresponding thermal images.
- Temperature measurements (max, min, delta T).
- Description of the anomaly.
- Severity assessment (e.g., “urgent,” “serious,” “monitor”).
- Recommended corrective action.
- “As found” and “as left” conditions (if repairs are made immediately).
- Tracking: Use your CMMS or a dedicated tracking system to log all findings, actions taken, and the status of identified issues.
Step 8: Review, Analyze Trends, and Optimize (Continuous Improvement)
- Action: Regularly review thermal inspection reports and maintenance history.
- Trend Analysis: Are certain assets consistently showing increasing temperatures? Are repairs addressing the root cause?
- Recurrence: Are the same issues recurring?
- Effectiveness: Is the current frequency effectively catching problems before failure?
- Adjustment: Based on this data:
- Increase Frequency: If an asset consistently shows rapid degradation or recurring issues.
- Decrease Frequency: If an asset remains stable and predictable over several inspection cycles, showing no significant thermal anomalies.
- Revise Action Thresholds: Adjust what constitutes an “actionable” thermal anomaly.
- Rationale: This continuous loop of inspection, analysis, and adjustment ensures your thermal mapping program remains effective and cost-efficient.
IV. Beyond Fixed Intervals: Condition-Based and On-Demand Mapping
While scheduled intervals are crucial, a truly optimized program incorporates flexibility.
A. Condition-Based Mapping
- Concept: Instead of strictly adhering to fixed calendar intervals, inspections are triggered by changes in an asset’s condition or performance parameters.
- Triggers:
- High-Load Periods: Inspecting equipment during peak operational loads.
- Increased Vibration/Noise: Sensors detecting unusual mechanical behavior.
- Process Parameter Deviations: SCADA or DCS systems indicating abnormal temperatures, pressures, or flows.
- Post-Maintenance: After major repairs or overhauls, an immediate thermal inspection (often referred to as a “commissioning” or “return-to-service” inspection) is crucial to verify proper assembly and operation.
- Benefit: Focuses resources where they are most needed, potentially reducing unnecessary routine inspections and ensuring critical checks after interventions.
B. On-Demand / Troubleshooting Mapping
- Concept: Performing an unscheduled thermal inspection in response to a specific problem or symptom.
- Triggers:
- Reported Fault: A piece of equipment is reported as malfunctioning or making unusual noises.
- Circuit Breaker Tripping: Investigating the cause of repeated electrical trips.
- Odor of Burning: Locating the source of an electrical smell.
- Unexpected Power Outage: A quick scan for a hot spot that might indicate the point of failure.
- Benefit: Rapidly identifies the root cause of failures, speeds up troubleshooting, and minimizes downtime. While not “preventive,” it’s a vital diagnostic tool.
C. Continuous Online Thermal Monitoring
- Concept: For extremely critical assets (e.g., large transformers, critical motors, data center racks), permanently installed thermal cameras provide continuous, real-time temperature data.
- Benefit: Immediate alerts for developing issues, enabling the fastest possible response and maximum uptime. This is the ultimate form of proactive thermal mapping for the highest criticality assets.
V. Common Scenarios and Recommended Frequencies
Let’s illustrate with some common facility components:
- Main Electrical Switchgear / Distribution Panels:
- Recommendation: Quarterly to Semi-annually. These are the heart of your electrical system; failure is catastrophic.
- Motor Control Centers (MCCs) / Large Motors (>50 HP):
- Recommendation: Quarterly to Semi-annually. Motors are high-failure items, and issues like bearing wear or winding faults often manifest thermally.
- Smaller Motors / Pumps / Fans (<50 HP):
- Recommendation: Annually. Unless they are critical to a continuous process, in which case semi-annually.
- Building Electrical Panels (Non-Critical):
- Recommendation: Annually. General health check.
- HVAC Systems (Air Handlers, Chillers, Condensers):
- Recommendation: Annually (before peak cooling/heating season). Check electrical components, fan motors, and condenser coils.
- Building Envelope (Walls, Roof, Windows):
- Recommendation: Every 1-3 years, ideally during significant temperature differentials (winter for heating climates, summer for cooling climates). Roofing specifically annually, often in fall after a warm day.
- Data Center Racks/Hot Aisles:
- Recommendation: Quarterly or monthly, or with continuous online monitoring for high-density racks. Overheating here directly impacts IT equipment lifespan and uptime.
- Process Piping/Vessels (Insulation integrity):
- Recommendation: Annually, especially for steam lines or insulated vessels where hot spots indicate insulation degradation and energy loss.
Conclusion: A Strategic Approach to Thermal Intelligence
The question of “how often should you conduct thermal mapping in your facility?” is not trivial. It’s a strategic inquiry that lies at the intersection of risk management, operational efficiency, and financial prudence. There is no universal answer because the optimal frequency is deeply embedded in the unique context of each facility’s assets, operational demands, and environmental challenges.
A truly effective thermal mapping program moves beyond arbitrary schedules. It begins with a meticulous assessment of asset criticality, a thorough understanding of operational environments, and a keen eye on historical performance data. This foundational work allows facility managers to prioritize where resources are most effectively deployed, ensuring that the most vital equipment receives the most frequent and rigorous scrutiny, while less critical assets are monitored on a more extended schedule.
The journey to an optimized thermal mapping frequency is also one of continuous improvement. By documenting findings, analyzing trends, and dynamically adjusting inspection intervals based on observed asset health and changing operational needs, facilities can evolve their thermography program from a reactive chore into a proactive, intelligent system. The ultimate goal is to achieve the delicate balance where potential issues are identified early enough to be addressed without incurring unnecessary inspection costs.
By embracing this comprehensive, factor-driven approach, facility managers empower their maintenance teams to move beyond mere troubleshooting. They harness the power of thermal intelligence to predict failures, prevent costly downtime, enhance safety, reduce energy consumption, and ultimately ensure the seamless, efficient, and reliable operation of their entire facility. The commitment to understanding and implementing the right thermal mapping frequency is not just a maintenance decision; it’s a strategic investment in the long-term health and success of your operations.